Green Tiger Markets May Electricity Update
- June 20, 2025
- 0

By Green Tiger Markets
Now that we have the first five billing months of 2025 in the rearview mirror, the GTM Team thought it would be helpful to investigate where power prices have shaken out so far and what the future may bring. Understanding why prices are clearing where they are is just as important, so we will also be taking a look at some of the driving factors.
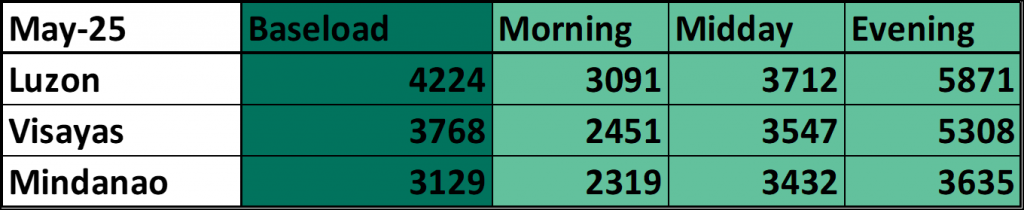
Through May, Luzon Baseload has averaged almost exactly 4Php/Kwh. Last year, the first 5 months averaged approximately 5.75, a dramatic change from last year. By day segment, the Mornings (-28%) and the Midday (-42%) prices have seen the most downside pressure while Evenings are only 24% lower. These movements in realized spot prices are rather dramatic and a welcome surprise for the average Filipino consumer.
Downside pressure in prices is coming from multiple factors which are all conspiring to make supply/demand balances looser year on year. Some of the key factors driving the decline in prices include:

Looking to the future, where might prices end up? The final 7 months of 2024 averaged 4.75. While we do expect that prices will continue to be soft, as more generation gets connected through year end, we don’t expect prices to average 30% under last year. Our forecast is closer to 20% under last year, leaving an average of 3.9 for 2025.
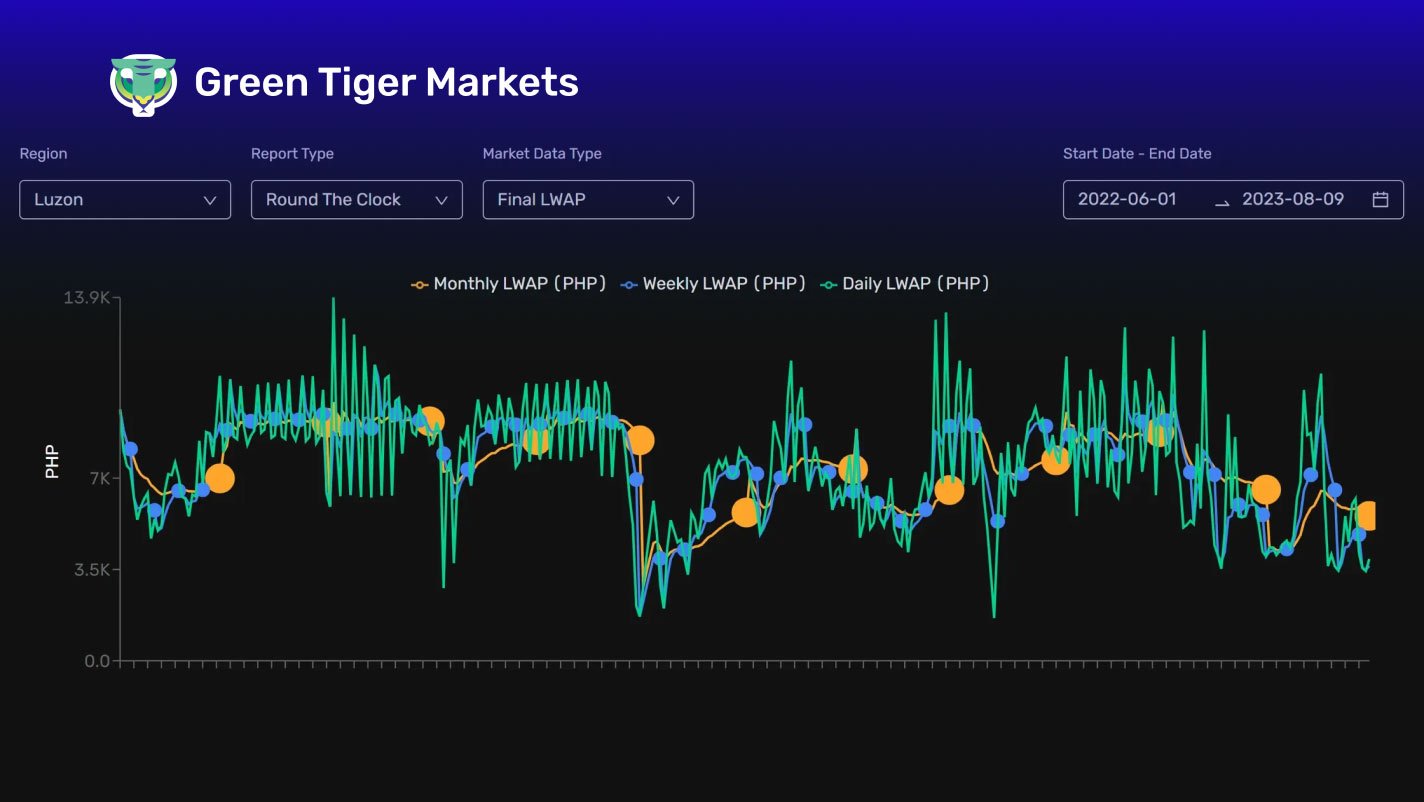
Market Data and Commentary
Since our last update, the Philippines electricity market has continued to experience notable shifts in WESM pricing, reflecting both market dynamics and structural advancements. In May 2025, WESM recorded a price decline, month on month, of about 10%, dropping to PHP 4224/MWh from PHP 4591/MWh in April. The price decline was driven by increased supply availability combined with modest demand, leaving significant reserve margins, as reported by IEMOP.
Soggy prices are becoming a greater concern for unhedged generators. To put it in perspective, for a generic 300Mw power plant, with 80% capacity factor, when prices average 5Php/Kwh, revenues are around 10.5bn. A 1Php/kwh move lower causes a drop in revenue of just over 2bn. Several generators benefited in years past from being unhedged, but this year is quite a shift for them.
Midday prices continue to feel downward pressure, though not as significant as last month. While we didn’t see any negative pricing hours in the Midday, prices still averaged about 12% under baseload. Our expectations are that Midday Hours pricing will continue to deteriorate into year end as more solar projects are tied in and energized.
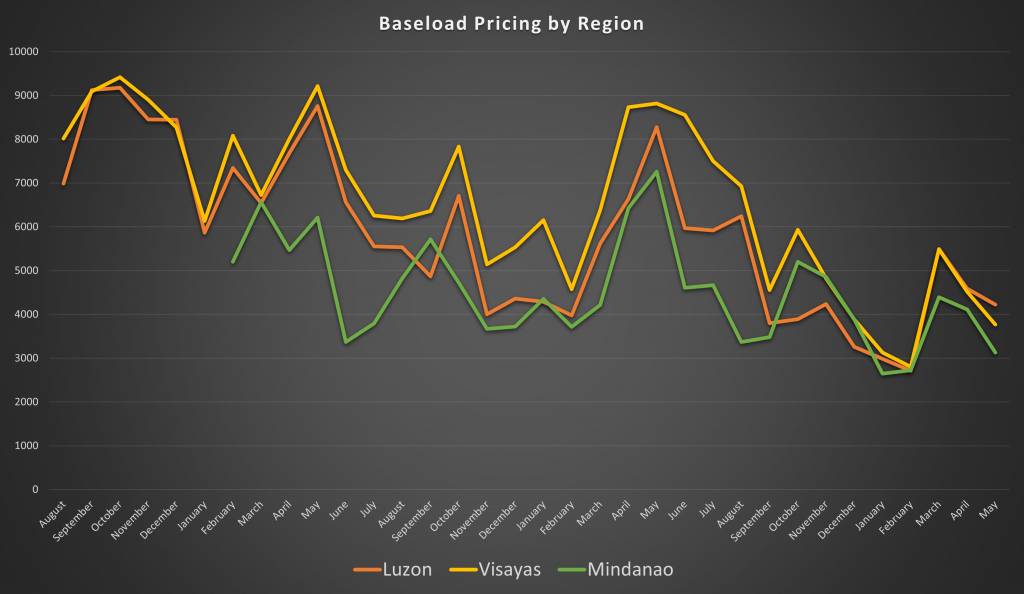
Of note, the spread between Luzon and Visayas has continued to come in with Luzon finishing May over Visayas. We were regularly seeing Visayas print 1000 or 2000 pesos over Luzon. The last few months have had them plugged right on top of one another, and now Visayas moving lower. It doesnt take much new generation at the margin to put a cap on Visayas.
As we step into June, we are in the traditional heart of the summer pricing, however this year, prices have been distinctly soft. Our early look actually has June coming in around 4250 so far, substantially weaker than where the forwards were just a few weeks ago. We had been expecting to see some stress in the grid for summer load, but those fears have yet to realize.
#1 Baseload Prices by Region
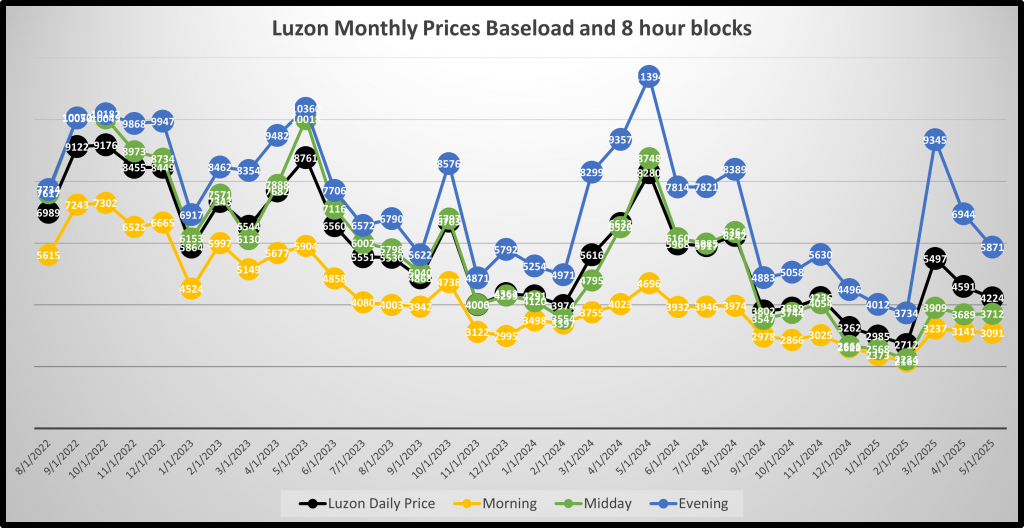
In our second graph below, we have plotted the 8 hour time block contracts as well as Baseload. Evening prices had been headed steadily lower since popping during the March outages. The downtrend resumed in May and will likely persist given the incremental solar coming to the market and the new gas fired thermal plants will have fewer premium hours to amortize their fixed costs over. There has been virtually zero need for diesel to run
Midday Hours continue dislocating lower on occasion, with steady repricing for the Midday Hours to match Morning Hours.
Evening hours could see pressure from some of the new gen that is being connected through the balance of the year, but it is a very much wait and see for the evening hours.
#2 Luzon prices by 8hr time block
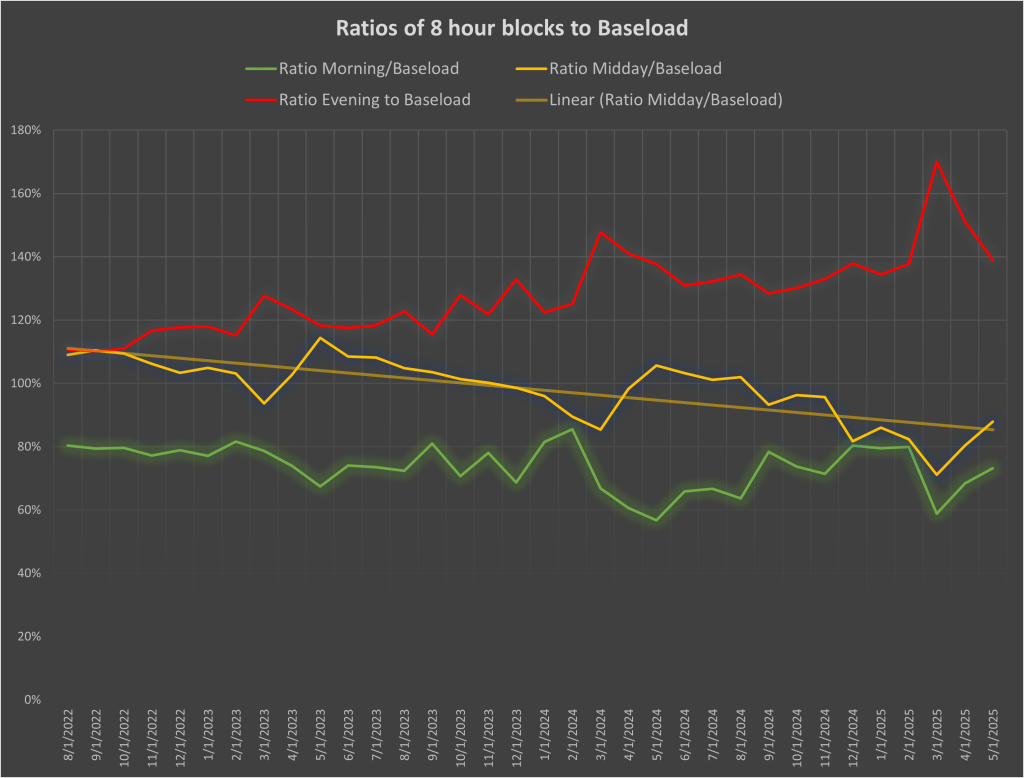
In our third graph below, we have plotted the ratios of the individual 8 hour products to Baseload. The trend continues for Evening Hours to diverge and become more “peaky”, though there was a slight retracement in May. The trend continues for Midday and Morning Hours to become more subdued relative to baseload. We are seeing Evening Hours prices clear roughly 40% over baseload for May and Midday running 15% below baseload. This does not bode well for unhedged solar developers, but could create a massive opportunity for battery operators as well as dispatchable hydro.
#3 Luzon monthly ratios by product
Year on Year comparison:
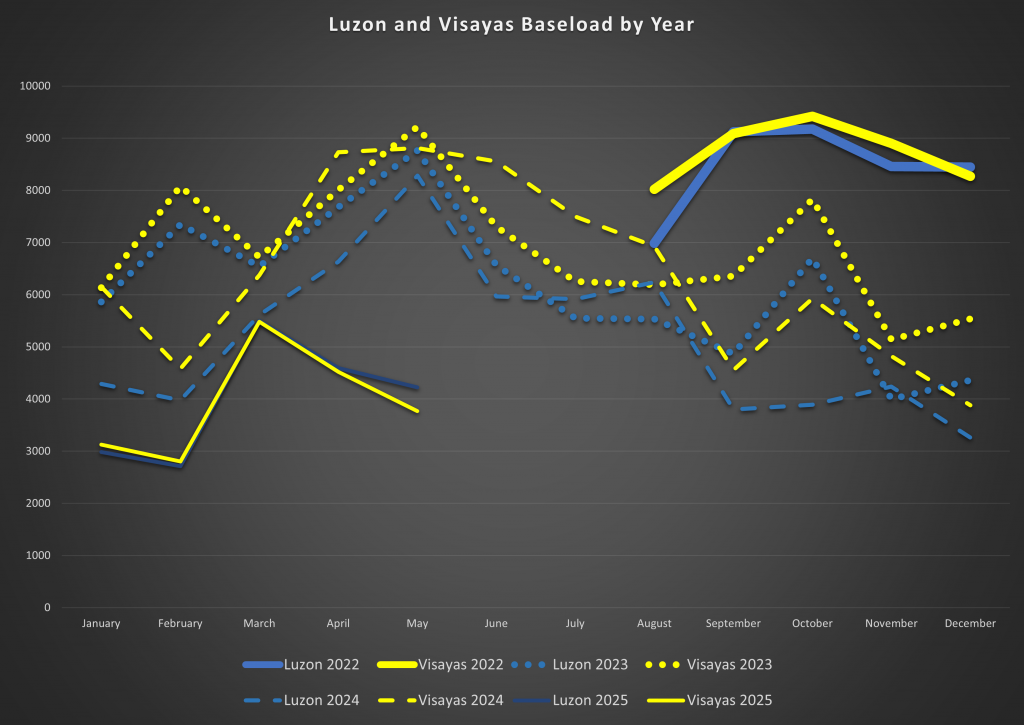
This year looks significantly different from the last few years. May resumed the weakness after the brief spike in March prices. On the year, Baseload is averaging around 4000, or a full 1750 php below last year. What does this mean for the balance of the year and into 2026? Will 2025 average in the 3s?
#4 Luzon and Visayas Baseload by year
Hourly Pricing:
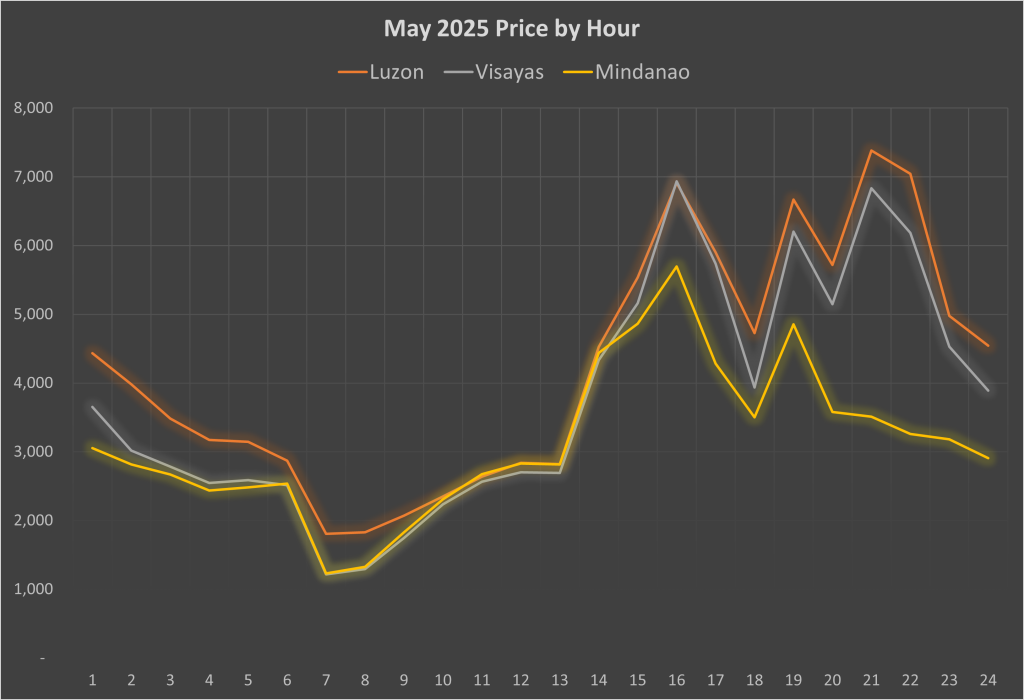
Below we have plotted hourly prices by region. Evening Hours continue to be strong relative to Midday and Morning prices. The “duck curve” is becoming more and more pronounced.
#6 Hourly Prices by Region
If you are interested in learning more about our data analysis, please don’t hesitate to contact us at [email protected].
This article was originally published on GreenTigerMarkets.com.